
What is rarity?
It could be a very philosophical question with no realy answer, but in this case there is a very clinical definition and mechanical process for evalution. In this post I will go over what rarity means in the context of NFTs, particularly in the context of programatically generated NFT collections.
tl;dr describes a method to calculate rarity for NFT collections. Produces an exact match to statistical rarity and vanilla rarity score on rarity.tools, but does not exactly match their “trait normalized rarity score”, which they do not publish a formula for. Scripts available on github.
EDIT: There are some open-source libraries for doing this now with results that
supposedly match rarity.tools:
mikko-o github repository for rarity-analyser for instance
There are also some video tutorials like this one:
Moralis rarity ranker
The archetype of programatically generated NFT collections is probably Cryptopunks or Cryptokitties, both projects launched by Larva Labs in 2017. Each punk is composed of a base “Punk Type” as well as a collection of “Attributes” applied to the base. Qualitatively the rarity is determined by the number of occurrences of the Punk Type, the number of occurrences of the Attributes, and the total number of Attributes applied to the Punk in the context of the entire collection of 10,000 punks. You can see an overview of the collection with the frequency of Base Type, Attributes, and Attribute Count on Larva Labs website here.

Cryptopunks on Opensea.io - last sold punks on 2021-08-31
What do we do if we want to quantitatively define a rarity score for each item
in the collection? That is the subject of this post, which will walk through
how to define that number, and then use some Python to generate a rarity score
for Goodboi in the Goodboisociety.io collection published
by Patrn LLC.
How to quantify rarity?
There are many ways that one could choose to quantify the rarity of a single NFT in a collection. Rarity tools has published a guide explaining four possibilities on their website here. Briefly, they are:
- Trait rarity ranking - solely dependent on the most rare trait a piece possesses
- Average trait rarity - A simple average of the percentage frequency of all traits associated with a piece
- Statistical rarity - Combining the percentage frequency of all traits by multiplying them together
- Rarity score - Scored by summing up the inverse of the percentage frequency of all traits (rarity.tools website’s method)
For instance, in the simple example below, we have a collection of 10 pieces, with three traits which each have three possibilities: body, hat, and teeth. If we score by trait rarity, then ID #s 2, 8, and 10 are all equally rare as they all possess a trait that only occurs once in the collection. If we use average trait rarity, then ID #5 is the rarest. With statistical rarity ID #s 2 and 5 are tied for rarest (lower is better here), and using rarity.tools rarity score metric ID #2 is the rarest (highest score is best here).
| ID | Body | Bodyfreq | Hat | Hatfreq | Teeth | Teethfreq | Traitrarity | Averagetrait | Statisticalrarity | Rarityscore |
|---|---|---|---|---|---|---|---|---|---|---|
| 1 | Human | 70% | Cap | 30% | Many | 60% | 30% | 53.3% | 0.126 | 6.4 |
| 2 | Alien | 10% | None | 50% | Many | 60% | 10% | 40% | 0.03 | 13.7 |
| 3 | Human | 70% | None | 50% | One | 30% | 30% | 50% | 0.105 | 6.8 |
| 4 | Human | 70% | None | 50% | Many | 60% | 50% | 60% | 0.21 | 5.1 |
| 5 | Zombie | 20% | None | 50% | One | 30% | 20% | 33.3% | 0.03 | 10.3 |
| 6 | Zombie | 20% | Cap | 30% | Many | 60% | 20% | 36.7% | 0.036 | 10 |
| 7 | Human | 70% | Tophat | 20% | Many | 60% | 20% | 50% | 0.084 | 8.1 |
| 8 | Human | 70% | Tophat | 10% | Many | 60% | 10% | 46.7% | 0.042 | 13.1 |
| 9 | Human | 70% | Cap | 30% | One | 30% | 30% | 43.3% | 0.063 | 8.1 |
| 10 | Human | 70% | None | 50% | None | 10% | 10% | 43.3% | 0.035 | 13.4 |
Python walkthough for getting and analysing data
Getting the data
In order to grab the data for each piece in the collection, we will just use this link to get a single file containing json records for all items in the collection. Save this file in your working directory as goodboi.json and we are ready to move on to the next section.
If you did not have access to a master json file containing all items in the collection, then you could get the “base_uri” from the smart contract and write a loop to download all of the data for each item individually from ipfs.
Taking the data into Python and counting trait frequencies
Now that we have all the data locally, we need to read it into Python so we can analyse with it. We’ll use a for loop to iterate over all of the items in the json file, and read each item in the collection into Python. First, lets define several classes that we will use to to handle the date as shown below:
collection.py
class Collection:
    '''Representation of an entire collection of items'''
    def __init__(self):
        self.traits = []                # List of tuples coupling (category, trait)
        self.item_count = 0             # Number of items in collection
        self.items = []                 # List of all item objects in collection
        self.trait_count = {}           # Mapping of number of traits to count
        self.categories = {}            # Dict of all categories in collection with counts and stuff

    def get_avg_trait_per_cat(self):
        '''Return the average number of traits per category'''
        traits_per_cat = []
        for c in self.categories.values():
            traits_per_cat.append(len(c.traits))
        return sum(traits_per_cat)/len(traits_per_cat)
item.py
class Item:
    '''Representation of item in a collection'''
    def __init__(self, data):
        '''Take data in from json file to create items'''
        self.traits = {}
        self.traits["trait_count"] = 0
        self.stat_rarity = 1
        self.rarity_score = 0
        self.rarity_score_normed = 0
        for a in data['attributes']:
            if a["trait_type"] == "Generation":
                self.ID = a["value"]
            elif a["trait_type"] == "birthday":
                self.birthday = a["value"]
            else:
                self.traits[a["trait_type"]] = a["value"]
                self.traits["trait_count"] += 1
category.py
class Category:
    '''Contain info on category including counts and stuff'''
    def __init__(self, name):
        self.name = name
        self.traits = []
        self.trait_count = {}
        self.trait_freq = {}
        self.trait_rarity = {}
        self.trait_rarity_normed = {}
These classes will store the data that is pulled out of the json file. The actual data processing and calculations, as well as data export are shown in the file below:
raritycalc.py
import json
import xlsxwriter
from category import Category
from collection import Collection
from item import Item

collection = Collection()

# Loop over the json file and add items to collection and count them
input_file = "./goodboi.json"
with open(input_file, 'r') as jsonfile:
    data = json.load(jsonfile)
    for c in data['collection']:
        collection.items.append(Item(c))
        collection.item_count += 1

# Loop over items in collection to get list of all category/trait tuples
for i in collection.items:
    for c, t in i.traits.items():
        if (c, t) not in collection.traits:
            collection.traits.append((c, t))
        else:
            pass

# Loop over items in collection to add None type to items and sort and create category objects
for i in collection.items:
    for t in collection.traits:
        # If item has empty attributes/traits in categories make them explicity None
        if t[0] not in i.traits.keys():
            i.traits[t[0]] = None
        # Set up category objects in collection
        if t[1] not in collection.categories.keys():
            collection.categories[t[0]] = Category(t[0])

# Loop over items in collection and count trait occurrences into category objects
for i in collection.items:
    for c, t in i.traits.items():
        #print(i.ID, t, v)
        if t in collection.categories[c].traits:
            collection.categories[c].trait_count[t] += 1
        else:
            collection.categories[c].traits.append(t)
            collection.categories[c].trait_count[t] = 1

# Loop over categories and calculate frequency and rarity score
for c in collection.categories.values():
    for t in c.traits:
        c.trait_freq[t] = c.trait_count[t]/collection.item_count
        c.trait_rarity[t] = 1/c.trait_freq[t]
        c.trait_rarity_normed[t] = c.trait_rarity[t]*(collection.get_avg_trait_per_cat()/len(c.traits))


# Loop over items and calculate statistical rarity and rarity score
for i in collection.items:
    for c, t in i.traits.items():
        i.stat_rarity = i.stat_rarity * collection.categories[c].trait_freq[t]
        i.rarity_score = i.rarity_score + collection.categories[c].trait_rarity[t]
        i.rarity_score_normed = i.rarity_score_normed + collection.categories[c].trait_rarity_normed[t]

# Open workbook for output to excel file, set up number formats
workbook = xlsxwriter.Workbook('../goodbois.xlsx')
ws1 = workbook.add_worksheet("Items")
ws2 = workbook.add_worksheet("Categories")
bold = workbook.add_format({'bold': True})
percent = workbook.add_format({'num_format': 10})
# Write headers for sheet 1 - items
ws1.write(0, 0, "ID", bold)
for idx, t in enumerate(collection.categories.values()):
    ws1.write(0, 2*idx+1, t.name, bold)
    ws1.write(0, 2*idx+2, "Freq. (%)", bold)
ws1.write(0, len(collection.categories)*2+1, "Stat. rarity", bold)
ws1.write(0, len(collection.categories)*2+2, "Rarity score", bold)
ws1.write(0, len(collection.categories)*2+3, "Rarity score normed", bold)
# Write data to sheet 1
for idx, i in enumerate(collection.items):
    ws1.write(idx+1, 0, i.ID)
    for idx2, t in enumerate(collection.categories.values()):
        if i.traits[t.name]:
            ws1.write(idx+1, 2*idx2+1, i.traits[t.name])
        else:
            ws1.write(idx+1, 2*idx2+1, "None")
        ws1.write(idx+1, 2*idx2+2, collection.categories[t.name].trait_freq[i.traits[t.name]], percent)
    ws1.write(idx+1, len(i.traits)*2+1, i.stat_rarity)
    ws1.write(idx+1, len(i.traits)*2+2, i.rarity_score)
    ws1.write(idx+1, len(i.traits)*2+3, i.rarity_score_normed)
# Write headers for sheet 2
idx = 0                                 # Counter used for writing to ws2
cat_offset = 0                          # Keep track of counts from last category
ws2.write(0, 3, "# of cats", bold)
ws2.write(0, 4, len(collection.categories))
ws2.write(0, 6, "# of traits", bold)
ws2.write(0, 7, len(collection.traits))
ws2.write(0, 9, "Avg # in cat", bold)
ws2.write(0, 10, collection.get_avg_trait_per_cat())
ws2.write(0, 12, "Med # in cat", bold)
ws2.write(0, 13, collection.get_med_trait_per_cat())
ws2.write(0, 15, "GM # in cat", bold)
ws2.write(0, 16, collection.get_gm_trait_per_cat())
ws2.write(0, 18, "HM # in cat", bold)
ws2.write(0, 19, collection.get_hm_trait_per_cat())
for k, c in collection.categories.items():
    ws2.write(idx+cat_offset, 0, k, bold)
    ws2.write(idx+1+cat_offset, 0, "Rank")
    ws2.write(idx+1+cat_offset, 1, "Name")
    ws2.write(idx+1+cat_offset, 2, "Rarity Score")
    ws2.write(idx+1+cat_offset, 3, "Count")
    ws2.write(idx+1+cat_offset, 4, "Percent")
    ws2.write(idx+1+cat_offset, 5, "Rarity Score Normed")
    ws2.write(idx+1+cat_offset, 6, len(c.traits))
    for t in c.traits:
        ws2.write(idx+2+cat_offset, 0, "rank")
        ws2.write(idx+2+cat_offset, 1, t)
        ws2.write(idx+2+cat_offset, 2, c.trait_rarity[t])
        ws2.write(idx+2+cat_offset, 3, c.trait_count[t])
        ws2.write(idx+2+cat_offset, 4, c.trait_freq[t])
        ws2.write(idx+2+cat_offset, 5, c.trait_rarity_normed[t])
        idx += 1
    cat_offset += 2
workbook.close()
In this file we:
- Loop over the json file and create an item object for each entry, and add that item to the collection
- Loop over all items to create a list of all unique category/trait pairs
- Loop over all items to set up categories and add “None” traits to items with no trait in that category
- Loop over all items and count trait occurrences into the category objects
- Loop over all categories and calculate frequency, rarity score, and trait normalized rarity score
- Loop over items and calculate statistical rarity, rarity score, and trait normalized rarity score
- Output all data to xlsx file
In this example xlsxwriter is used to output the Excel file - this is a free package available to install via pip. On the first page of the excel file is a row for each item, a column for each trait and the frequency of that trait’s occurrence, and in the last three columns are: statistical rarity, vanilla rarity score, and trait normalized rarity score. The statistical rarity and vanilla rarity score are described above. The trait normalized rarity score is what rarity.tools uses by default (in addition to “uniqueness” and additional trait weighting).
From what I understand trait normalized rarity should give more weight to categories fewer traits in them. So, the way I calculated it was to take the vanilla rarity score and multiply that by the average number of traits per category divided by the number of traits in that category, so categories with fewer traits will have generally higher rarity scores. I played around with different versions of this (using median or geometric mean instead of simple mean) and squaring or square rooting things, but I was unable to exactly match rarity.tools scores for Bored Ape Yacht Club for the trait normalized rarity, which would be the score shown when the trait normalization switch is turned on in the image below, but uniqueness and additional weighting are turned off. I’m not sure exactly how they give a score to “uniqueness”, but for the “Additional Weighting” they simply multiply the rarity score by the weighting factor squared.
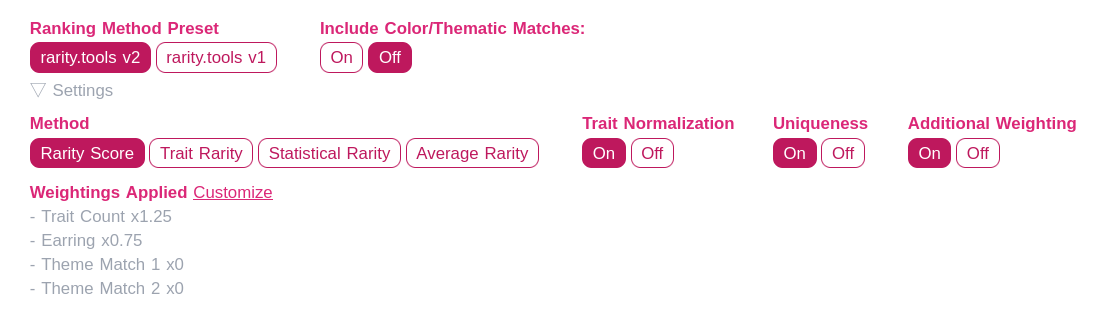
Rarity score options on rarity.tools website
On the bright side - I was able to exactly match the statistical rarity and
vanilla rarity score (rarity score with “Trait Normalization”, “Uniqueness”, and “Additional Weighting” turned off)
for the Bored Ape Yacht Club rarity scores on rarity.tools. If you’d like to try
and play around with these scripts you can find them here:
https://github.com/patrn-me/rarity-calc