The Google Trends Case for Bitcoin Investment
This is not financial advice. This is me poking at a chart and talking myself into and then out of a thesis, in public.
The thesis is simple and very old: retail attention shows up in Google Trends, Bitcoin is heavily driven by retail attention, therefore search interest tells you something about where the price is going. People have been trading this idea, badly, since at least 2013.
The seductive part
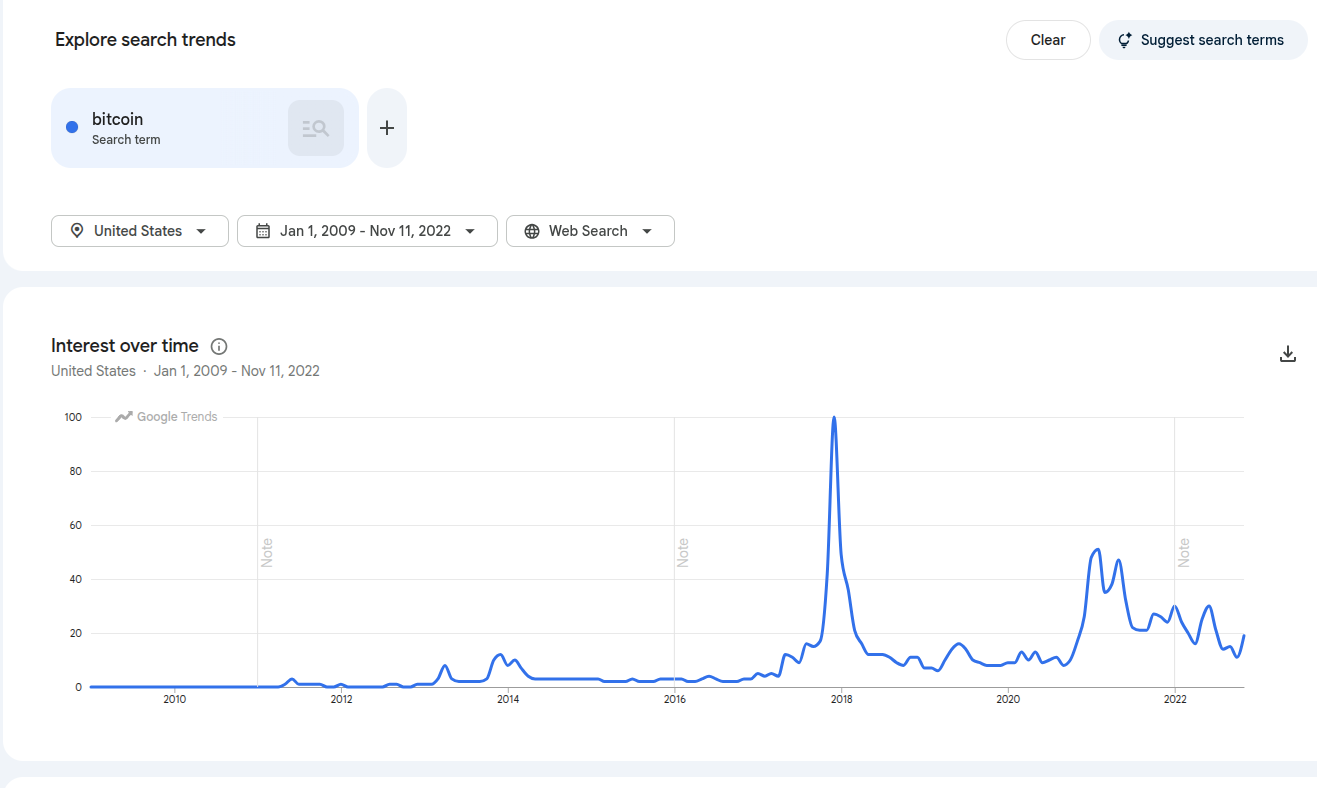
Pull up the search term "bitcoin" on Google Trends and overlay it on the price. The correlation is genuinely striking. The big interest spikes line up almost perfectly with the major price runs. Every cycle, "bitcoin" claws its way back up the most-searched keyword lists, and every cycle, your relatives start asking you about it at dinner.
There's a real mechanism underneath this, not just numerology. Price goes up, journalists write about it, people Google it, some fraction of those people buy, which pushes the price up further, which generates more coverage. It is a textbook reflexive feedback loop. Search interest is one of the cleaner, free, public measurements of where you are in that loop.
So far so good. This is where most "Google Trends predicts Bitcoin" blog posts stop, usually right before recommending you buy.
 hover / hold for original
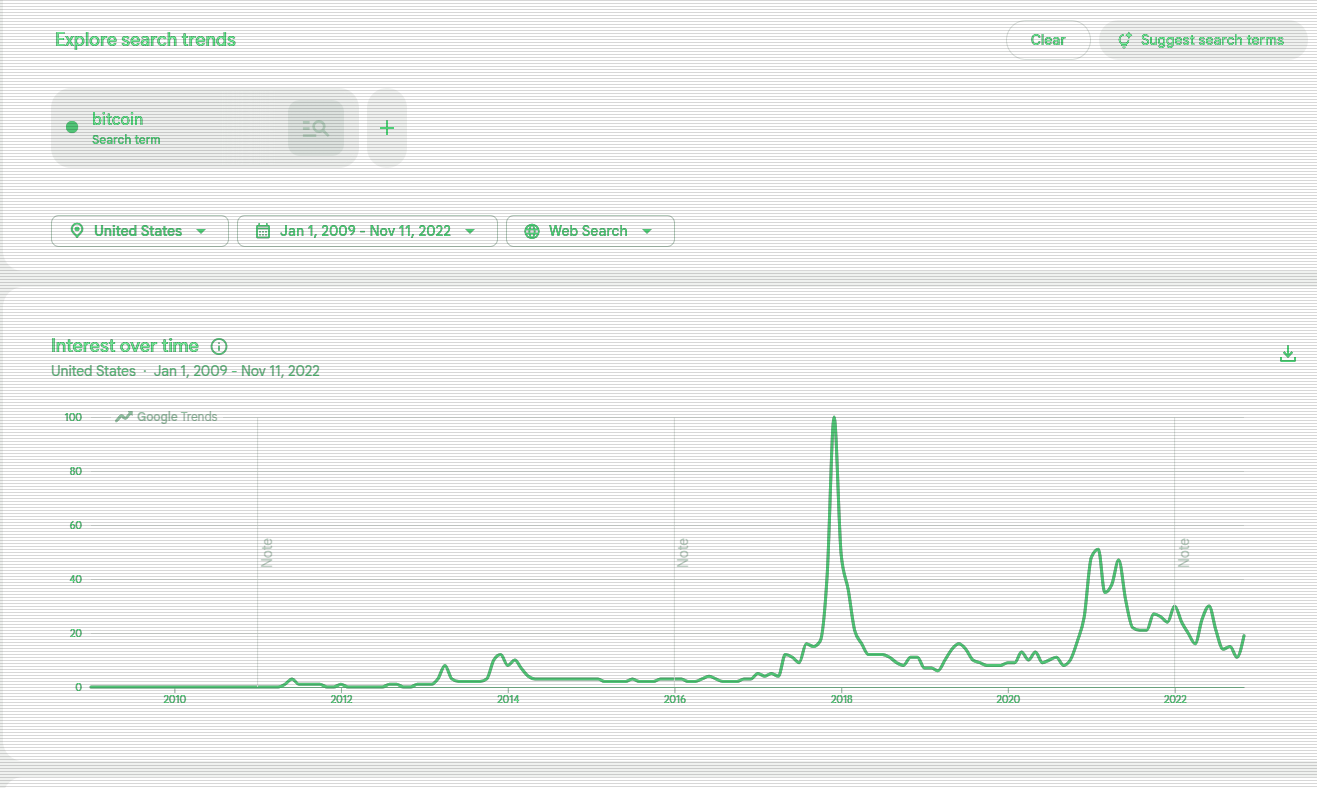
So I actually ran the numbers
The folk version of this thesis says search interest lags the price: it pumps, the news covers it, your barber asks about it, and by then the move already happened. Tidy story. I wanted to see if it survives contact with the data, so I pulled the monthly "bitcoin" Trends series and daily BTC and ETH closes and lined them up. My price history only goes back to March 2019, so this is really a look at the 2021 cycle, not the 2013 or 2017 ones.
The results are messier than the story.
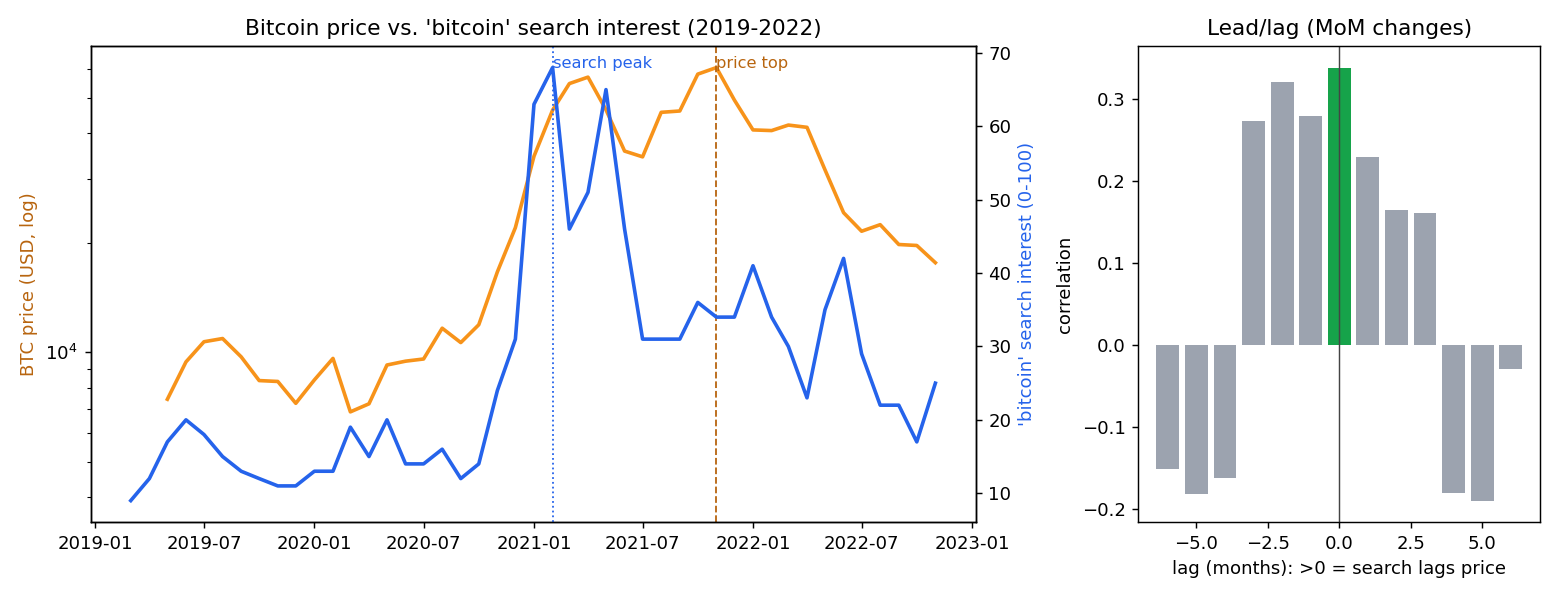
The levels track each other strongly, correlation 0.77. That is the seductive chart, and it is close to meaningless: both series rose together and fell together across one big cycle, so almost anything trending would correlate.
On month-over-month changes, which is the part you would actually trade, the relationship is weaker (0.34 for bitcoin, 0.56 for ether) and it peaks at a lag of zero. Search interest and price move in the same month. It does not lead, and at this resolution it does not cleanly lag either. Where the cross-correlation tilts at all, it tilts slightly toward search moving first on the way up, which is the opposite of the folk claim.
The "peak attention marks the top" idea does not hold for this cycle either. The single biggest search month was February 2021. The price top was November 2021, about nine months later. Attention maxed out on the first violent leg up and then faded while the price ground to a higher high with the public mostly checked out.
 hover / hold for original
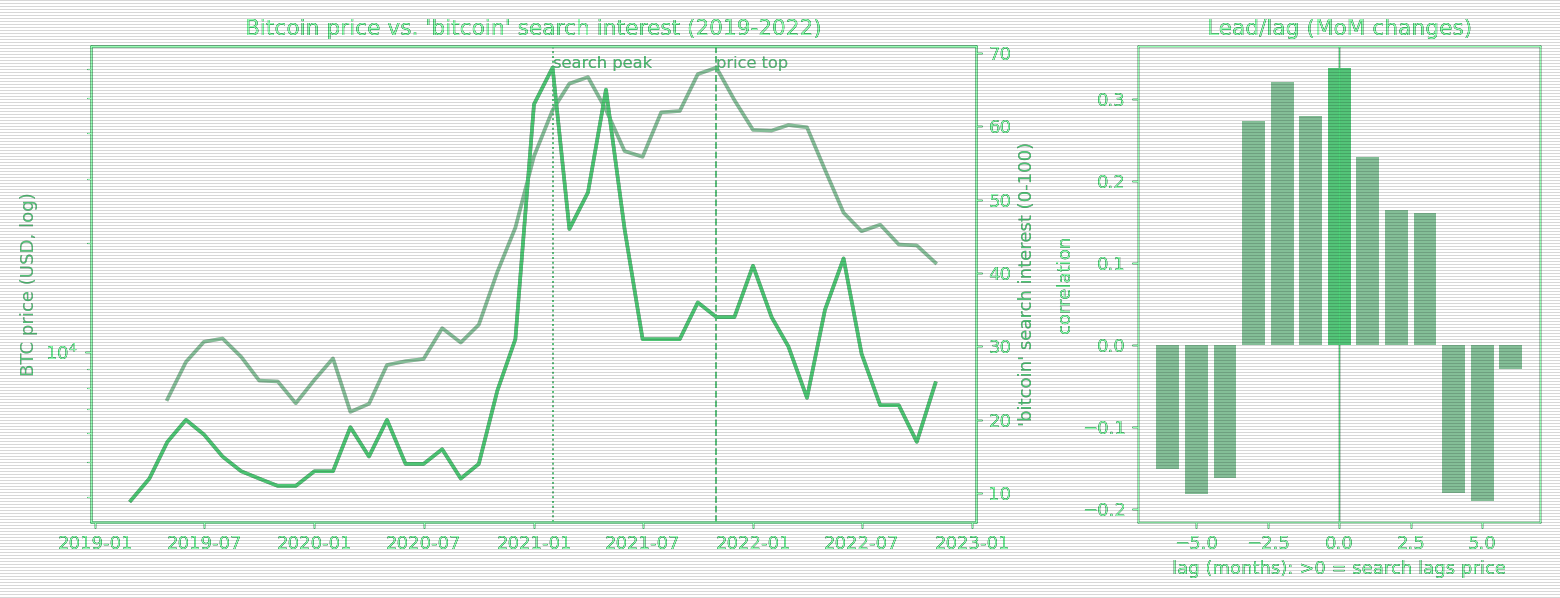
I would not over-read one cycle of monthly data. Weekly Trends data would resolve the lead/lag question better than monthly buckets can, and I only have one clean cycle of price history to work with. The headline holds up though: the relationship is contemporaneous and reflexive, not a clock you can set.
The other problems, briefly
- The keyword is ambiguous. "bitcoin" search volume mixes buyers, sellers, the merely curious, scam victims, and people who just read a headline. You can't tell fear from greed from a single line.
- It's gameable and noisy. Trends is relative, regionally weird, and a single news event or celebrity tweet can spike it in ways that have nothing to do with flows.
- Everyone already knows about it. Any edge a free, public, decade-old indicator ever had has been arbitraged into the floor. If it were tradable, it wouldn't be.
So what
As a timing tool it is junk, and the numbers back that up: a contemporaneous signal cannot tell you anything the price has not already told you.
As a thermometer it still has some use, just less than I wanted. When "bitcoin" is screaming up the charts and people who have never owned a wallet are asking how to buy, you are clearly somewhere in a frenzy, and frenzies are a reason for caution. What this cycle showed is that the thermometer does not tell you when the frenzy ends. Attention peaked in early 2021 and the price kept going for most of a year. "Sentiment is hot" is real information. "Sentiment is hot, therefore sell now" is not in the data.
It is a toy thesis. Have fun with it, don't bet the house on it, and don't buy or
sell because your search history told you to. The data and a roughly sixty-line
pandas script are in the repo (scripts/analysis/) if you want to rerun it on a
longer price history than mine.
Update, June 2026
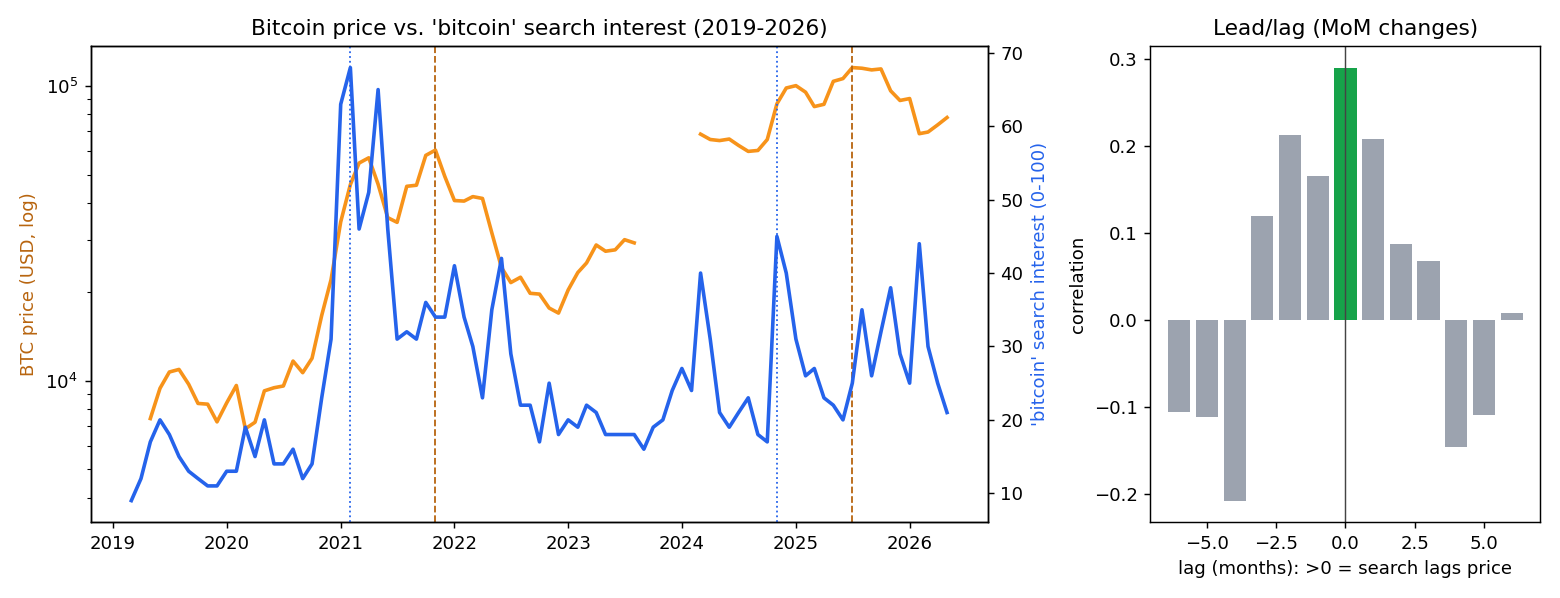
I wrote the above in late 2022, near the end of one cycle. Since then there has been a whole other one, so I re-ran the same analysis with data through mid-2026. Two full cycles now instead of one. The 2022 read did not just hold, it got sharper, and in a direction that kills the folk version of the thesis for good.
In both cycles, search interest peaked months before the price top, not after it:
- 2021 cycle: search peaked February 2021, the price topped that November. About nine months early.
- 2024-25 cycle: search peaked November 2024, the price topped July 2025 near $115k. About eight months early.
Same shape both times. Attention spikes on the first violent leg up, when the move is new and surprising, and then it fades while the price grinds to a higher high with the public mostly checked out. Peak retail attention has marked the early part of each bull run, not the end of it. That is the opposite of "my barber asking about it means we are at the top," and it is also the opposite of the "search lags price" story. Over the full window, month-over-month changes still line up best at zero lag (correlation 0.29 for bitcoin, 0.54 for ether): the two move together within a month, with no usable lead or lag.
 hover / hold for original
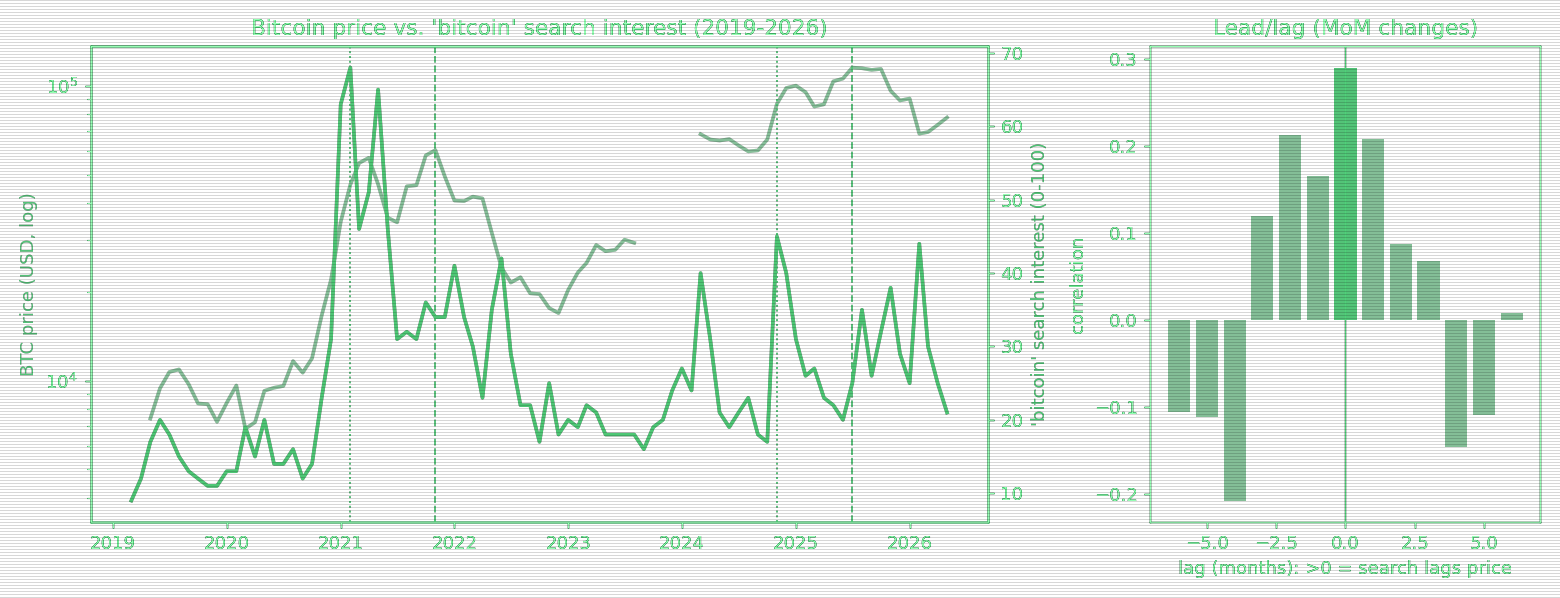
The honest caveats are the same, plus one. It is still monthly data, it is still only two cycles (n=2 is not a backtest), Google Trends renormalizes its scale every time you change the window, and the BTC price export I used has a gap from August 2023 to March 2024, the notch in the price line. None of that changes the basic picture: search interest is a coincident, reflexive measure of attention, attention front-runs the price top by the better part of a year, and you cannot set a clock by it.
You can rerun this yourself. It is about ninety lines of pandas:
Show the analysis code (Python)
#!/usr/bin/env python3
"""Does Google search interest lead or lag the Bitcoin price?

Companion analysis for the blog post "The Google Trends Case for Bitcoin
Investment" and its 2026 update. Reproducible: data is in ./data, the figure
goes to the post's image folder.

Inputs (./data):
  gtrends_2009_2026.csv          monthly Google Trends ("bitcoin","ethereum"), 2009-2026
  btc_daily.csv, eth_daily.csv   daily close (Nasdaq export, 2019-2026)

Price history starts 2019-03, so the quantitative window is 2019-2026, which
covers two cycles: the 2021 top and the 2024-2025 top.
"""
import os
import pandas as pd
import matplotlib
matplotlib.use("Agg")
import matplotlib.pyplot as plt

HERE = os.path.dirname(os.path.abspath(__file__))
DATA = os.path.join(HERE, "data")
OUT = os.path.join(HERE, "..", "..", "public", "images", "blog", "googletrends",
                   "bitcoin-price-vs-search-2026.png")


def load_search(col):
    df = pd.read_csv(os.path.join(DATA, "gtrends_2009_2026.csv"))
    df["Time"] = pd.to_datetime(df["Time"])
    return df.set_index("Time")[col]


def load_price(fname):
    df = pd.read_csv(os.path.join(DATA, fname))
    df["Date"] = pd.to_datetime(df["Date"], format="%m/%d/%Y")
    df = df.set_index("Date").sort_index()
    return pd.to_numeric(df["Close/Last"], errors="coerce").resample("MS").mean()


def cross_corr(search, price, max_lag=6):
    """corr of month-over-month changes; lag k>0 => search lags price by k months."""
    ds, dp = search.pct_change(fill_method=None), price.pct_change(fill_method=None)
    rows = [(k, ds.corr(dp.shift(k))) for k in range(-max_lag, max_lag + 1)]
    return rows, max(rows, key=lambda t: (t[1] if pd.notna(t[1]) else -9))


def peaks(s, p, lo, hi):
    m = (s.index >= lo) & (s.index <= hi)
    return p[m].idxmax(), s[m].idxmax()


def analyze(name, col, price_file):
    s, p = load_search(col), load_price(price_file)
    idx = s.index.intersection(p.index)
    s, p = s.loc[idx], p.loc[idx]
    rows, (lag, rlag) = cross_corr(s, p)
    print(f"\n== {name}  ({idx.min().date()}..{idx.max().date()}, {len(idx)} mo) ==")
    print(f"  r levels={s.corr(p):.2f}  r changes={s.pct_change(fill_method=None).corr(p.pct_change(fill_method=None)):.2f}"
          f"  best lag={lag:+d}mo (r={rlag:.2f})")
    for lbl, lo, hi in [("2021 cycle", "2020-06", "2022-12"), ("2024-25 cycle", "2023-01", "2026-06")]:
        pp, sp = peaks(s, p, lo, hi)
        print(f"  {lbl}: price top {pp.date()} (${p[pp]:,.0f})  search peak {sp.date()} "
              f"({int(s[sp])})  -> search {(sp.to_period('M') - pp.to_period('M')).n:+d} mo vs top")
    return s, p, rows, lag


def main():
    s, p, rows, lag = analyze("Bitcoin", "bitcoin", "btc_daily.csv")
    analyze("Ethereum", "ethereum", "eth_daily.csv")

    fig, (ax1, ax3) = plt.subplots(1, 2, figsize=(12, 4.6),
                                   gridspec_kw={"width_ratios": [2.3, 1]})
    ax1.set_title("Bitcoin price vs. 'bitcoin' search interest (2019-2026)")
    ax1.semilogy(p.index, p.values, color="#f7931a", lw=2)
    ax1.set_ylabel("BTC price (USD, log)", color="#b8650f")
    ax2 = ax1.twinx()
    ax2.plot(s.index, s.values, color="#2563eb", lw=2)
    ax2.set_ylabel("'bitcoin' search interest (0-100)", color="#2563eb")
    for lo, hi in [("2020-06", "2022-12"), ("2023-01", "2026-06")]:
        pp, sp = peaks(s, p, lo, hi)
        ax1.axvline(pp, color="#b8650f", ls="--", lw=1)
        ax2.axvline(sp, color="#2563eb", ls=":", lw=1)

    ks = [k for k, _ in rows]
    ax3.set_title("Lead/lag (MoM changes)")
    ax3.bar(ks, [r for _, r in rows],
            color=["#16a34a" if k == lag else "#9ca3af" for k in ks])
    ax3.axvline(0, color="#444", lw=0.8)
    ax3.set_xlabel("lag (months): >0 = search lags price")
    ax3.set_ylabel("correlation")
    fig.tight_layout()
    os.makedirs(os.path.dirname(OUT), exist_ok=True)
    fig.savefig(OUT, dpi=130)
    print(f"\nwrote {os.path.relpath(OUT, os.path.join(HERE, '..', '..'))}")


if __name__ == "__main__":
    main()
Downloads: the script, monthly Google Trends CSV, BTC daily, ETH daily. Put the CSVs in a data/ folder next to the script and run it.
If you want me being skeptical about crypto governance instead of crypto charts, see Monero is a DAO.